US Treasury Spot Curve
This is a type of discounting curve used for zero coupon cash flows.
when you are receiving payments in the future.
You can create a treasury spot curve by using the yields from treasury bonds.
Also known as Risk Free Zero Coupon Curve, Spot Rate Yield Curve, Implied Zero Coupon Curve
This curve shows the yield to maturity of zero-coupon treasury securities.
US Treasury STRIPS
The yields on coupon strips are by definition zero coupon rates.
on the run
coupon paying treasury bonds
Could use UK government bonds
If US Treasuries are used, the curve is often called the Treasury Spot Curve
This the relationship between the yield to maturity on a zero coupon bond and the bonds maturity date.
Only zero-coupon bonds have no reinvestment risk associated with them.
It is the reinvestment risk (or assumption) that makes this curve a better choice than the Yield to Maturity curve.
Zero-coupon yields are the key determinant of value in the capital markets and they are calculated and quoted for every major currency.
Zero coupon yields can be used to value any cash flow that occurs at a future date.
Constructing the Curve using Coupon Paying Bonds
How do we construct the zero-coupon yield curve from coupon paying bonds.
When we use zero coupon bonds to construct our Discount Curve, the curve is often called the Zero Rate Curve.
We can do this using a process called Bootstrapping
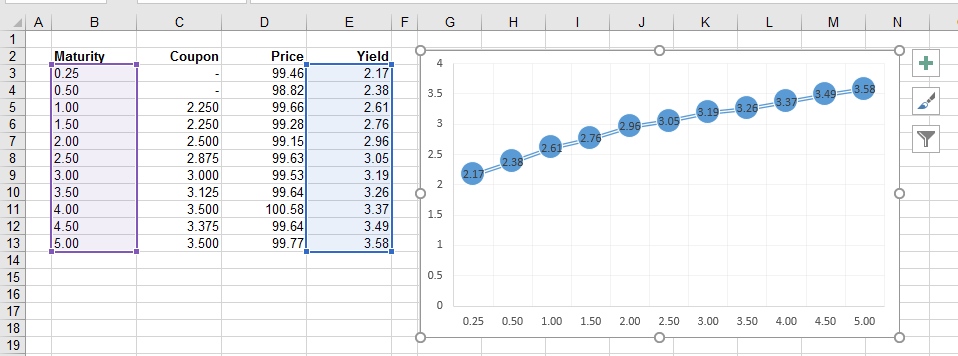
Lets suppose that we have the following US Treasury Bills and Notes
The chart shows these yields plotted against their maturity dates.
 |
1 Year Spot Rate
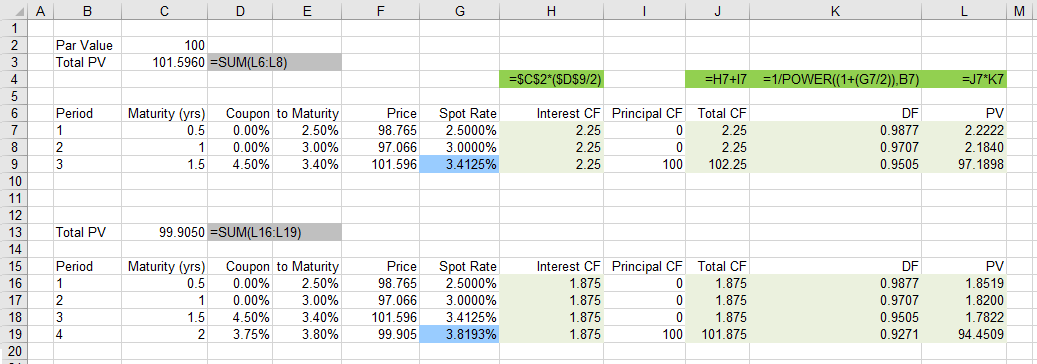
We already know the 0.25 and 0.5 spot rates since these Treasury Bills are already zero-coupon bonds.
So lets calculate what the 1 year spot rate would be.
We can calculate this using a method called bootstrapping.
1.5 Year Spot Rate
 |
The yield on a zero-coupon intrument is called the spot rate.
The zero-coupon yield curve is not an accurate indicator of average market yields because most bonds are not zero-coupon.
Yield Curve
Also known as Yield to Maturity Curve, bond yield curve, coupon curve, redemption yield curve, coupon bearing yield curve
You can take any type (or class) of bond and plot the yield to maturity for different maturity dates.
Treasury Yield Curve
When people talk about the Yield Curve they usually mean the Treasury Yield Curve.
The treasury yield curve shows the relationship between the treasury securities (bills and bonds paying coupons) and maturity
The yield curve is the term structure of interest rates and is defined as the relationship between the maturity of a zero-coupon bond and the yield to maturity.
A yield curve is a plot depicting yield as a function of time to maturity.
The most important usage for the yield curve is to evaluate the bond market.
This is the relationship between the discount rate and the days to maturity (time)
The yield to maturity for a bond is used to indicate the total return from the bond when held to maturity.
This is the curve that most people are referring to when they talk about yield curves.
This curve consists of the points "yield" vs "maturity" (at whatever price it is quoted, there is only one current price).
Creating
This can be constructed by taking one class of bond (for example US Treasuries) and plotting the calculated yield to maturity for different maturity dates.
Visit the following website to see the latest yield to maturities for all the currently listed treasury securities
link - marketwatch.com/market-data/rates?mod=market-data-center
Assumption
A big assumption is that it assumes that all the coupons are re-invested immediately at the coupon rate.
Obviously market rates will change over time so being able to re-invest at exactly this rate is unlikely.
This assumption creates reinvestment risk
Only bonds from the same class of issuer (and liquidity) are used
Everything is the same except the maturity dates.
The YTM of a coupon paying bond is a weighted average calculation of the zero-coupon rates up to maturity.
The later the coupon the more the weight is placed on it.
Important
The yield to maturity calculation assumes a flat yield curve.
Curves are normally plotted against whole years although the bonds used will rarely have an exact number of years to maturity.
On Bloomberg this is screen IYC
UK Government Spot Curve
Constructing the Spot Curve using the Swap Curve
It is possible to create a spot curve using the swap curve which is based on market swap rates.
Constructing the Swap Curve
We need to find the equivalent of a zero-coupon bond at certain maturities.
Once we have this information we can apply the bootstrap method to create a curve.
The LIBOR without any qualification means the US dollar LIBOR rate
The market instruments used are the most liquid and dominant interest rate products to certain time horizons
A curve is usually divided into three parts:
Short End - using determined using LIBOR
Middle Part - using Eurodollar futures or Forward rate agreements
Far End - using Mid Swap Rates
Short Term (Deposit) : < 3 months
Derived using overnight, 1 week, 1 month, 2 month and 3 month
Each deposit instrument pays out a single payment at the end of its term.
These are quarterly compounding
Unsecured Deposits from the money markets
You can use LIBOR
EURIBOR
EONIA
In Paris we have PIBOR, Frankfurt FIBOR etc
Federal Funds Rate
we can use the following formula
SS
Middle Term (Future) : 3 months < > 2 years
Forward Rate Agreements (Interest Rate Forwards)
OR
Eurodollar futures (EDF) - linked to 3 month LIBOR rates / short term interest rate futures - also needs a convexity bias adjustment
Long Term (Swaps) : 2 years <> 10 years
Swaps Market
using par swap rates derived from the Interest Rate Swap market
You can use LIBOR based interest rate swaps
Banks with high credit ratings lend and borrow money at the LIBOR interest rates
These rates are typically slightly higher than government curves
The swap rate is the weighted arithmetic average of forward rates for the term to maturity.
The "swap rate" curve shows the fixed-rate leg of a plain vanilla swap against the floating leg of a six month LIBOR
The Swap curve and the treasury spot curve are often drawn together
When a swap curve is different to the yield curve you have Swap Spread
Comparing to Treasury Yield Curve
LIBOR is richer at the short end
LIBOR does not extend past 1 year
Example
Lets imagine a 6 year loan with a floating interest rate of LIBOR + 0.5% per annum and lets assume the interest must be paid every 6 months.
Therefore every 6 months the interest rate is defined as 0.5% above the 6 month LIBOR rate and is set at the beginning of the 6 month period.
The interest rate is typically set at the beginning of the 6 month period, but payment is not due until the end of the 6 month period.
This is the interest rate at which banks are able to borrow funds from one another
It is used for short-term lending transactions
The rate is published at 11:30am GMT
Banks submit the rate which they are willing to offer deposits to other banks
The libor rate remains fixed for 24 hours
There are at least 8 banks contributing for each currency
The submitted rates are then ranked and the average rate is taken from the middle two quartiles
10 major currencies
15 borrowing periods (overnight to 1 year)
Discount Rate/Lombard Rate
This is the rate at which the bank will discount eligible bills of exchange (i.e. top quality bills) for other banks.
The maturity of these bills must not exceed 3 months. As this rate is below other rates there is a quota for each bank or life would be too easy. If we could discount a bill at 9.5% and then finance ourslevs at 8 3/4% at the central bank we would soon make lots of money.
Interest Rates - The terms "bid rate" and "offer rate" are usually met in securities markets.
The offer is always higher than the bid and the difference is called the "spread" (typically quite small)
When it comes to wholesale money, the banks deposit rate is called the "bid rate" and their lending rate is called the "offer rate"
The interbank lending rates in London are therefore
In the US the interbank rate is called the "Federal Funds Rate"
Interest rates vary with time and so the interbank rates for 1 month, 3 months, 6 months and 12 months will probably all be different.
What is the Sterling LIBOR rate today ?
There will always be referring to the 3 month rate
The interbank market in London deals in all currencies and the wholesale rates offered by different banks could be different.
If we say Sterling LIBOR is 10 1/16 % we mean the average of all the major banks in the market.
Lending rates are typically quoted as LIBOR + or - ? basis points
Constructing the Spot Curve using the Forward Curve
© 2025 Better Solutions Limited. All Rights Reserved. © 2025 Better Solutions Limited TopPrevNext