Trendlines
A trendline is an additional line that indicates the slope (or trend) in a particular data series and is also known as a line of best fit.
Trend lines can be helpful when you are analysing data because they can forecast future values based upon your current data.
A trendline is a line of best fit
Trendlines are often used for regressions analysis (or curve fitting).
You can also use Moving Averages to smooth out the fluctuations in a data series.
Which Chart Types ?
A trendline can be added to a data series in the following chart types: xy scatter, area, bar, column, line, stock, bubble
A trendline cannot be added to data series in a stacked, 3D, radar, pie, surface or doughnut chart.
If you change the chart type to a chart types that does not support trendlines then the trendline will not be displayed (deleted ?)
SS example trendline area
For line data when you do not need a chart you can use the AutoFill or one of the stats functions GROWTH or TREND to create data for best-fit linear or exponential lines.
Different Types of Trendlines ?
When you want to add a trendline to your chart there are 6 different trend types to choose from.
SS
Forecasting data using a trend line though will only be accurate if you choose the correct type of trend line.
Depending on the type of data will depend on which trend type is most appropriate.
A trendline is most appropriate when its R-squared value is at or near to 1.
When you add a trendline to a chart Excel automatically calculates the R-squared value.
| Linear | Creates a best fit straight line that shows how values in a data series increase or decrease at a steady rate. |
| Logarithmic | |
| Polynomial | You must also specify the order |
| Power | |
| Exponential | |
| Moving Average | You must also select the number of periods |
What type of Data
A trendline is not always appropriate. It all depends on the type of data.
Data that is appropriate for a trend line would be:
Paired umbers which can be plotted on an XY Scatter
Charts that have a Date category values (assuming no gaps)
It is possible to add a trendline to a chart that has a Text category axis but it just wont mean anything
A trendline is always associated with a particular data series
It is possible for one data series to contain multiple trend lines
Linear
Creates a best fit straight line that shows how values in a data series increase or decrease at a steady rate.
A linear trendline is a best-fit straight line that is used with simple linear data sets.
Your data is linear if the pattern in its data points resembles a line.
A linear trendline usually shows that something is increasing or decreasing at a steady rate.
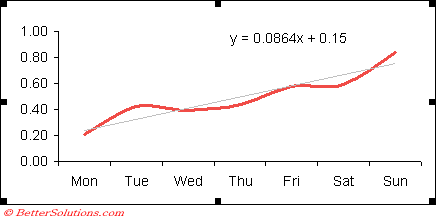
A trendline by using the following linear equation to calculate the least squares
y=mx + b
where m is the slope and b is the intercept
Equation: y = m * x + b
m: =SLOPE(y,x)
b: =INTERCEPT(y,x)
Correlation coefficient
r = CORREL(y,x)
R-squared = RSQ(y,x)
Select (Chart > Add Trend Line).
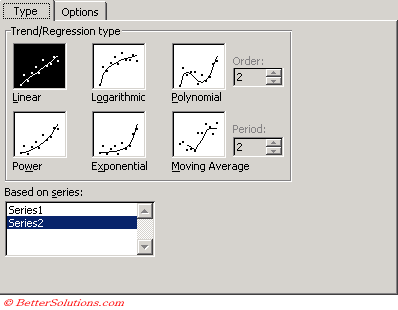 |
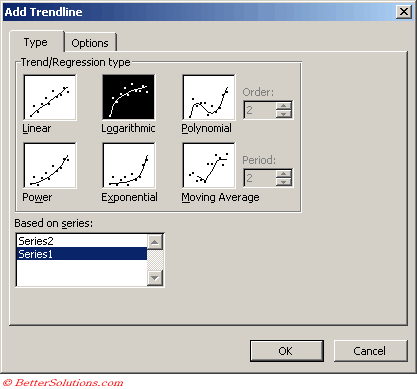
The Based on Series box lists all of the data series in the chart that support trendlines.
This lets you easily change the series which has the trendlines associated with it.
 |
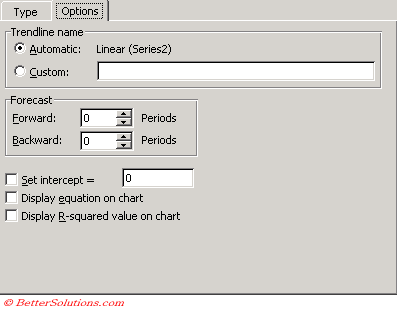 |
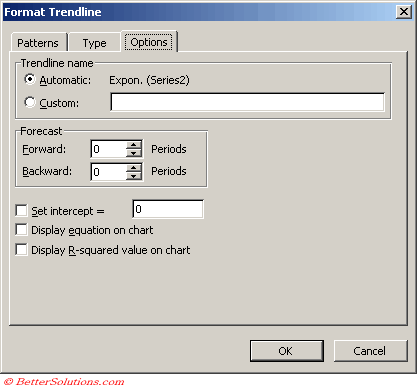
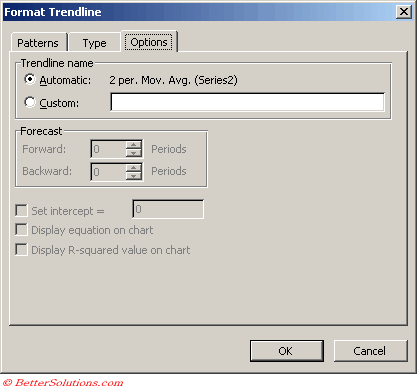
Trendline Name - This is the text that appears in the legend. If not specified it will default to the trendline type followed by the series name in parentheses
Forecast - Allows you to extend the trendline forward
Set Intercept - Allows you to specify the point on the value axis where the trendline crosses the axis
Display equation on chart - Displays the equation on the chart. You can overwrite this with different text but if you do it will remain static text
Display R-squared value on chart - Displays the R-squared value on the chart. You can overwrite this with different text but if you do it will remain static text
Logarithmic
Creates a best-fit curved line that illustrates how data values increase or decrease and then level out.
You can use both negative and positive values.
A logarithmic trendline is a best-fit curved line that is used when the rate of change in the data increases or decreases quickly and then levels out.
A logarithmic trendline can use both negative and positive values.
A logarithmic trendline by using the following equation to calculate the least squares fit through points
y=c ln x + b
where c and b are constants and ln is the natural logarithm function
Equation: y = (c * LN(x)) - b
c: =INDEX(LINEST(y,LN(x)),1)
b: =INDEX(LINEST(y,LN(x)),1,2)
Select (Chart > Add Trend Line).
 |
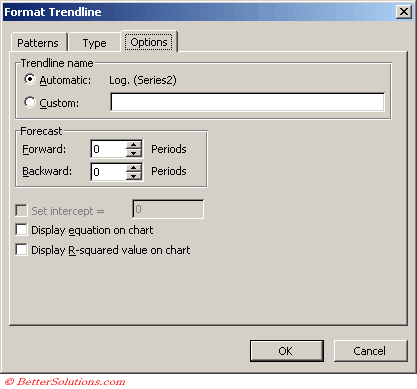 |
Polynomial
Creates a curved line illustrating fluctuations in the data values.
This trendline has an additional parameter
You can specify an order value to indicate the maximum number of fluctuations or bends that occur on the line.
A polynomial trendline is a curved line that is used when data fluctuates.
It is useful, for example, for analyzing gains and losses over a large data set.
The order of the polynomial can be determined by the number of fluctuations in the data or by how many bends (hills and valleys) appear in the curve.
An Order 2 polynomial trendline generally has only one hill or valley.
Order 3 generally has one or two hills or valleys. Order 4 generally has up to three.
A polynomial or curvilinear trendline by using the following equation to calculate the least squares fit through points:
y=b + c1x + c2x2 + c3x3 +
where c1, c2, c3, are constants
2nd Order Polynomial Trendline
Equation: y = (c2 * x^2) + (c1 * x ^1) + b
c2: =INDEX(LINEST(y,x^{1,2}),1)
C1: =INDEX(LINEST(y,x^{1,2}),1,2)
b = =INDEX(LINEST(y,x^{1,2}),1,3)
3rd Order Polynomial Trendline
Equation: y = (c3 * x^3) + (c2 * x^2) + (c1 * x^1) + b
c3: =INDEX(LINEST(y,x^{1,2,3}),1)
c2: =INDEX(LINEST(y,x^{1,2,3}),1,2)
C1: =INDEX(LINEST(y,x^{1,2,3}),1,3)
b: =INDEX(LINEST(y,x^{1,2,3}),1,4)
Notice the pattern in the two preceding sets of formulas
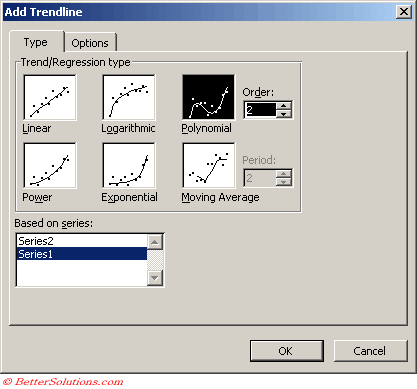 |
Type the highest power for the independent variable in the Order box
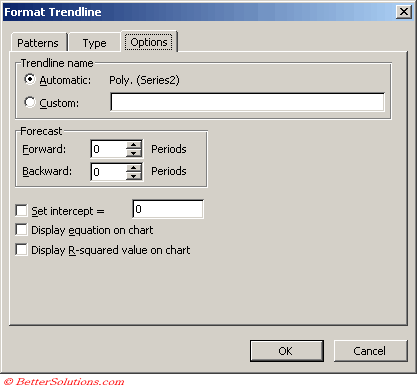 |
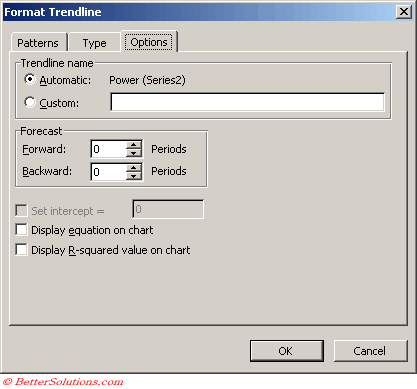
Power
Creates a curved line to compare measurements that increase at a specific rate.
This trendline is not available if the data series contains any zero or negative numbers
This can only be used with positive values.
A power trendline is a curved line that is used with data sets that compare measurements that increase at a specific rate for example, the acceleration of a race car at 1-second intervals.
You cannot create a power trendline if your data contains zero or negative values.
A power trendline by using the following equation to calculate the least squares fit through points
y=cxb
where c and b are constants
Note: The option is not available when your data includes negative or zero values
Equation: y=c*x^b
c: =EXP(INDEX(LINEST(LN(y),LN(x),,),1,2))
b: =INDEX(LINEST(LN(y),LN(x),,),1)
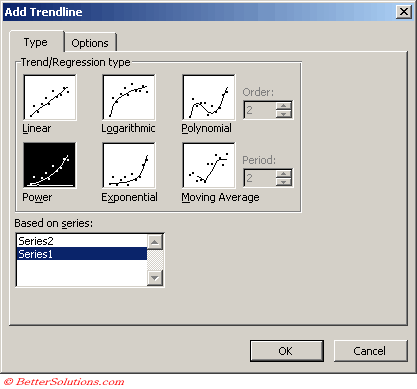 |
 |
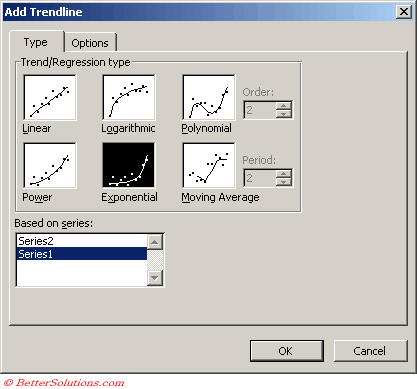
Exponential
Creates a curved line that shows data values that increase or fall at increasingly higher rates.
This trendline is not available if the data series contains any zero or negative numbers
This can only be used with positive values.
An exponential trendline is a curved line that is used when data values rise or fall at increasingly higher rates.
You cannot create an exponential trendline if your data contains zero or negative values.
y=cebx
where c and b are constants and e is the base of the natural logairthm
Note: The option is not available when your data includes negative or zero values
Equation: y = c *e ^(b * x)
c: =EXP(INDEX(LINEST(LN(y),x),1,2))
b: =INDEX(LINEST(LN(y),x),1)
 |
 |
Moving Average
Reduces the fluctuations in the trend line to a show smoother pattern.
This trendline is not available if the data series contains any zero or negative numbers
You use the period field to specify the number of data values to create the line.
Excel creates the line by averaging the specific data values.
For example if the period value is 2, the first two values are averaged, that value is the first point on the line, and then the second and third values are averaged and that becomes the second point.
A moving average trendline smoothes out fluctuations in data to show a pattern or trend more clearly.
A moving average uses a specific number of data points (set by the Period option), averages them, and uses the average value as a point in the line.
If Period is set to 2, for example, then the average of the first two data points is used as the first point in the moving average trendline.
The average of the second and third data points is used as the second point in the trendline, and so on.
A moving average trendline by using the following equation
Ft = (At + At-1 + At-2 + ) / n
Note the number of points in a moving average trendline equals the total number of points in the series less the number that you specify for the period.
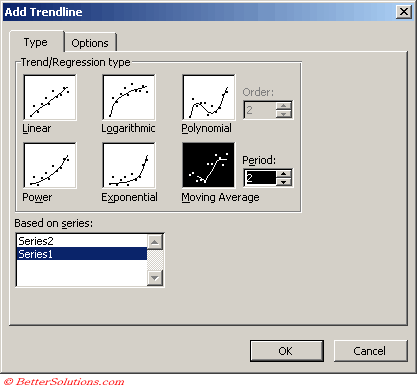 |
Type the number of periods to be used to calculate the moving average in the Period box.
 |
Regression Analysis
Regression Analysis is a form of statistical analysis which is used for forecasting.
Regression Analysis estimates the relationship between variables so that a given variable can be predicted from one or more other variables.
By using regression analysis you can extend a trendline on a chart beyond the actual data to rpedict future values.
Interpolation is a specific case of curve fitting in which the function must go through "all" the data points.
R-Squared Value
include the equation
The R-sqaured value is the square of the correlation coefficient
Most statistical tests show the correlation coefficent as "r", but Excel displays it as "R".
This coefficient gives us a measure of the reliability of the linear relationship between the x and y values. Values close to 1 indicate excellent linear reliability.
The R-squared value that you can display with a trendline is not an adjusted R-squared value
For logarithmic, power and exponential trendlines Excel uses a transformed regression model.
To display more or less decimal places on the equation or R squared value when displaying on a chart, select the box and press the Increase Decimal or Decrease Decimal buttons
Remember
Interpolation is the method of constructing new data points when you have a discrete set of known points.
You can quickly remove a trendline by right clicking on it and selecting Clear (or Delete key).
If you add a moving average to a scatter chart the moving average is based on the order of the x-values plotted in the chart. To get the result that you want you might need to be sort the x-values before adding the trendline.
Trendline Coefficients and Regression Analysis
- tushar-mehta.com/publish_train/data_analysis/16.htm
© 2026 Better Solutions Limited. All Rights Reserved. © 2026 Better Solutions Limited TopPrevNext