Analysis ToolPak
The Analysis-ToolPak add-in provides special analysis tools suitable for medium scale statistical analysis.
This add-in only needs to be installed if you are actually going to use the additional Data Analysis functionality.
Excel will take slightly longer to open when this add-in is installed.
Data Analysis
Once you have the Analysis-ToolPak add-in installed an extra button will appear on the far right of your Data tab.
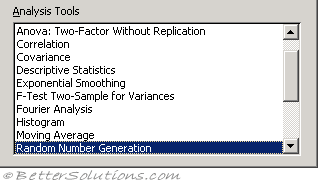
This will give you a choice of the following analysis tools:
 |
| Anova: Single Factor | Determines if there is a relationship between two data sets by performing an analysis of variance. |
| Anova: Two Factor with Replication | Determines if there is a relationship between two data sets by performing an analysis of variance. This includes more than one sample of data for each group. |
| Anova: Two-Factor without Replication | Determines if there is a relationship between two data sets by performing an analysis of variance. This does not include more than one sample of data for each group. |
| Correlation | Compares two sets of data to determine if there is any relationship between them. |
| Covariance | Calculates the average of the product of deviations of values from the means of each data set. |
| Descriptive Statistics | Calculates a range of statistical measurements and summarises them into a table. This table includes calculations for: Mean, Standard Error, Median, Mode, Standard Deviation, Sample Variance, Kurtosis, Skewness, Range, Minimum, Maximum, Sum, Count, Largest, Smallest and Confidence Level. |
| Exponential Smoothing | Smooths data, weighting more recent data heavier. |
| F-Test Two Sample for Variances | Compares the variances between two groups of data. Variance is a measure of how much the values are dispersed around the mean value. |
| Fourier Analysis | Discrete Fourier Transform (DFT) or Fast Fourier Transform (FFT) method, including reverse transforms. |
| Histogram | Counts occurrences in each of several data bins. |
| Moving Average | Calculates a moving average to allow you to smooth out a data series that contains peaks. |
| Random Number Generation | Creates a number of several types of random numbers including Uniform, Normal, Bernoulli, Poisson, Patterned and Discrete. |
| Rank and Percentile | Creates a list of the numbers ranked from highest to lowest and also provides a percentile value which indicates how an individual number ranks compared to the other numbers. |
| Regression | Creates a table of statistics that result from least-squares regression. |
| Sampling | Samples a population randomly or periodically. |
| T-Test: Paired Two Sample for Means | Paired two-sample students T-Test. |
| T-Test: Two Sample assuming equal Variances | Paired two sample T-Test assuming equal means. |
| T-Test: Two Sample assuming unequal Variances | Heteroscedastic T-Test ? |
| Z-Test: Two Sample for Means | Two sample Z-Test for means with known variances. |
| Anova: Single Factor Determines if there is a relationship between two data sets by performing an analysis of variance. |
| Anova: Two Factor with Replication Determines if there is a relationship between two data sets by performing an analysis of variance. This includes more than one sample of data for each group. |
| Anova: Two-Factor without Replication Determines if there is a relationship between two data sets by performing an analysis of variance. This does not include more than one sample of data for each group. |
| Correlation Compares two sets of data to determine if there is any relationship between them. |
| Covariance Calculates the average of the product of deviations of values from the means of each data set. |
| Descriptive Statistics Calculates a range of statistical measurements and summarises them into a table. This table includes calculations for: Mean, Standard Error, Median, Mode, Standard Deviation, Sample Variance, Kurtosis, Skewness, Range, Minimum, Maximum, Sum, Count, Largest, Smallest and Confidence Level. |
| Exponential Smoothing Smooths data, weighting more recent data heavier. |
| F-Test Two Sample for Variances Compares the variances between two groups of data. Variance is a measure of how much the values are dispersed around the mean value. |
| Fourier Analysis Discrete Fourier Transform (DFT) or Fast Fourier Transform (FFT) method, including reverse transforms. |
| Histogram Counts occurrences in each of several data bins. |
| Moving Average Calculates a moving average to allow you to smooth out a data series that contains peaks. |
| Random Number Generation Creates a number of several types of random numbers including Uniform, Normal, Bernoulli, Poisson, Patterned and Discrete. |
| Rank and Percentile Creates a list of the numbers ranked from highest to lowest and also provides a percentile value which indicates how an individual number ranks compared to the other numbers. |
| Regression Creates a table of statistics that result from least-squares regression. |
| Sampling Samples a population randomly or periodically. |
| T-Test: Paired Two Sample for Means Paired two-sample students T-Test. |
| T-Test: Two Sample assuming equal Variances Paired two sample T-Test assuming equal means. |
| T-Test: Two Sample assuming unequal Variances Heteroscedastic T-Test ? |
| Z-Test: Two Sample for Means Two sample Z-Test for means with known variances. |
© 2026 Better Solutions Limited. All Rights Reserved. © 2026 Better Solutions Limited TopPrevNext